In this article I have explained 3 different light meter circuits for measuring power of light. In the first method we will use only a solar cell and a multimeter, in the second method we will use an op amp and a moving coil meter, and in the third method we will see how a sequential LED bar graph can be used for measuring the intensity of light.
What is a Light Meter and How it Works
A light meter circuit is a device which detects the intensity of light through a light sensor, and displays the measured results on an analogue or digital meter.
The main idea proposed in this article does not work with a cumbersome and fragile moving coil meter, rather it simply displays the light intensities through an array of LEDs.
The LED array illuminates sequentially as the light intensity on the light sensor increases, and the LEDs shut off sequentially as the light on the sensor decreases.
The LED illumination has two modes of operation, bar graph mode and dot mode.
In the bar graph mode, when the light intensity increases on the sensor, the LEDs illuminate sequentially upwards continuously one after the other to indicate the higher equivalent readings. When the light intensity decreases on the sensor, the LEDs are shut off one by one to indicate the lower specific readings.
This creates an effect of a rising and falling LED bar graph, in response to the input light variations.
In the dot mode working, only one LED proceeds upward or downwards such that at any position only one LED remains illuminated for indicating the measured light intensity on the scale.
In this article we will explore 3 easy methods of measuring light through 3 different light meter circuits.
Using Solar Cell and Multimeter
Perhaps the most simplest method to measure light intensity is simply by connecting a small solar cell with a voltmeter, as shown below.
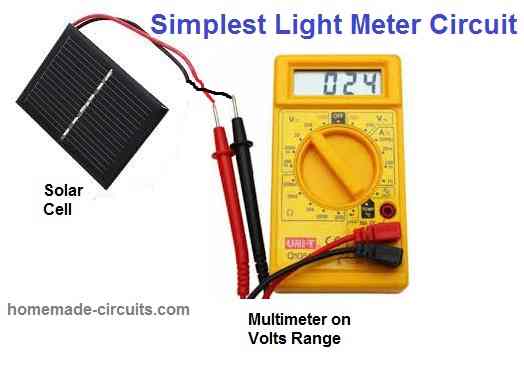
The voltmeter can be from your existing multimeter. The multimeter could be set at the 1 V range and used for directly checking the voltage reading from the solar cell which will be directly proportional to light intensity falling on the solar cell.
The solar cell can be any small solar cell which are usually used in calculators or any other equivalent.
Using an Op Amp
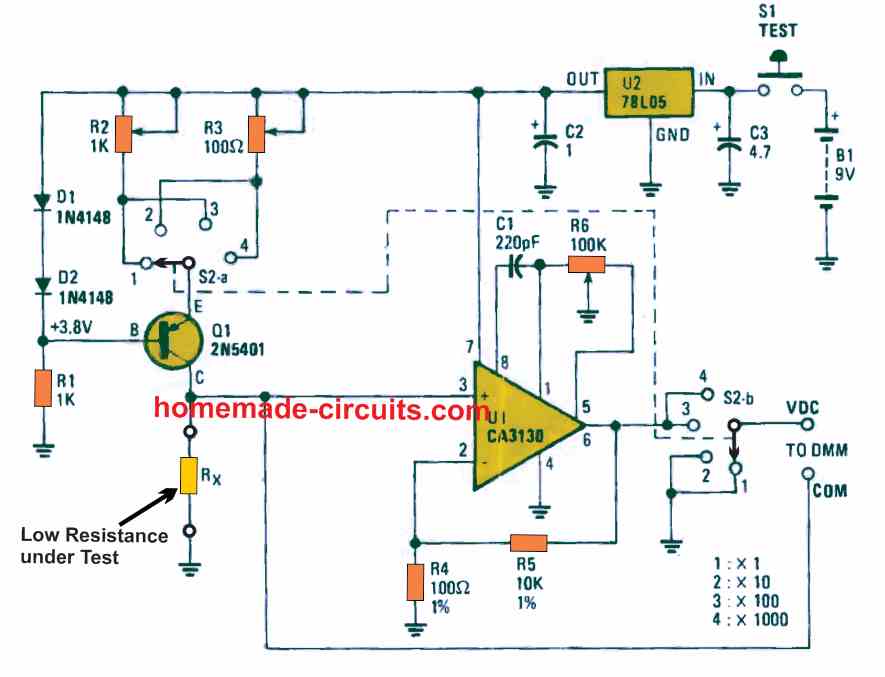
For more accurate results, an op amp based circuit could be used for making a light meter circuit as shown in the following diagram.
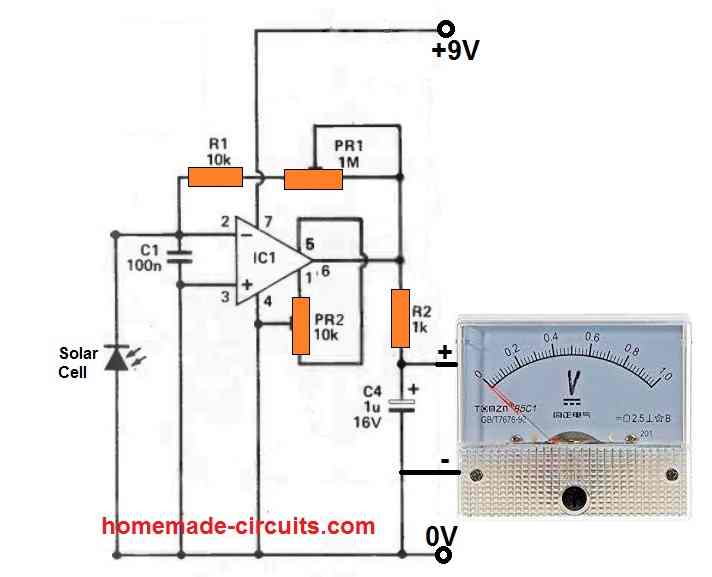
The op amp basically works like a current to voltage amplifier. It amplifies the tiny current from the solar cell into a relatively large measurable voltage. So basically it works like a current to voltage converter.
There are two presets which can be appropriately adjusted for calibrating the attached meter scale. We will discuss this elaborately later in the article.
The IC CA3140 is used as the op amp since it has a high impedance and low drift, which ensures more precision and reduced errors on the output readings.
The output of the op amp is directly connected to a moving coil type 0-1V voltmeter for the intended measurements.
If we assume the output to be Vo, input current from the solar cell to be Iin, and the feedback resistor (R1+PB1) to be Rf, then the output voltage Vo can be calculated using the following formula:
Vo = Iin x Rf
Using LED Bar Graph
In the above concept we used a moving coil meter which may not be a preferable option for many of the users.
A simple, solid-state and an effective method to display the light intensity readings can be through an array of LEDs that would show the readings in a sequential fashion.
This can be implemented by using our very old, ubiquitous IC, the LM3914 or LM3915, which is a LED bar/dot mode, sequential LED driver IC.
As can be seen in the diagram below, to build a LED bar graph light meter circuit, we simply integrate the output of the previous op amp circuit with the LM3914/LM3915 IC input.
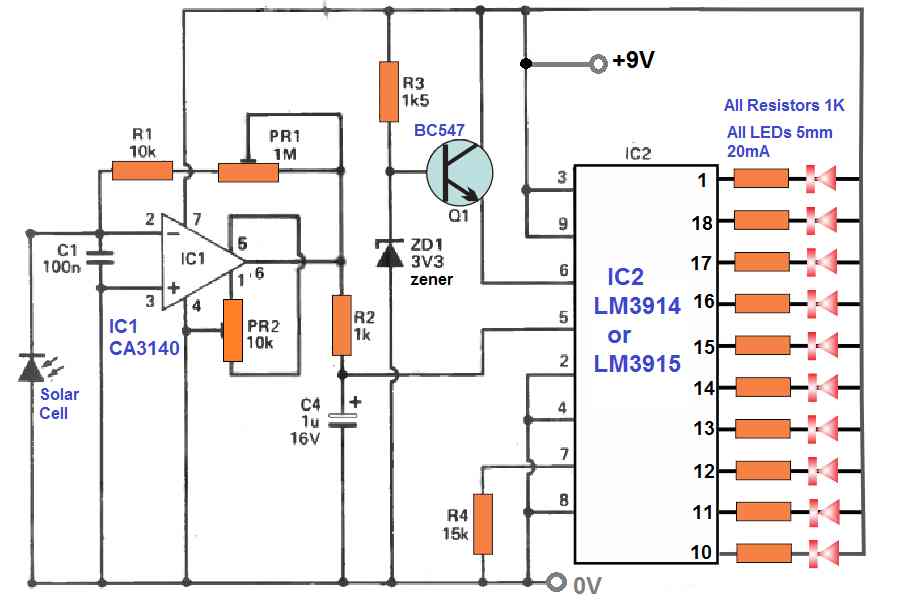
As the light on the solar cell varies, the op amp amplifies the variations and feeds the varying signal to the input of the LM3914/LM3915 IC, which quickly translates the signals into an LED bar graph reading.
The switch can be wired at pin#9 of the IC and this can be selected to set the IC output either to a bar graph mode or to a dot mode.
In a bar graph mode when the LEDs illuminate one after the other sequentially, the previous LEDs do not shut off, thus the sequencing creates a rising bar kind of effect. In dot mode, as the LED sequence moves up/down, the previous LEDs shut off sequentially, causing only one LED to remain illuminated at any given instant, creating an "dot" kind of effect.
How to Calibrate
Calibrating the op amp based light meter circuits is very easy.
Initially cover the solar cell with a black tape so that no light can reach the solar cell. Next, adjust the PR2 preset until the meter needle reaches the zero mark, and for LED graph, adjust PR2 until the all the LEDs are just shut off.
Next, for the full scale deflection reading on the meter or for an equivalent all LEDs illuminated, allow a known quantity of high intensity light to fall on the solar cell.
After this adjust the PR1 preset, until the meter reads a full scale deflection or on the LED graph all the LEDs are illuminated.
The known intensity of light can be obtained through a good quality lux meter.
Once the 0 to maximum scale is determined, the intermediate numbers can be easily fixed by creating uniform graduations across the entire scale, proportionately.
How to Select Bar Mode or Dot Mode
To select between LED bar graph mode or LED dot mode, you can simply connect an ON/OFF switch between pin#9 and pin#3 of the IC. When this switch is turned ON to short pin#9 and pin#3, then the output LEDs run on bar graph mode. When this switch is kept open, the output LEDs run on dot mode.
Simplifying using LM3914 IC and a Phototransistor
The above 10 LED bar graph light meter concept can be further simplified by incorporating a single LM3914 IC, a phototransistor sensor and LED bar graph panel as I have explained below.
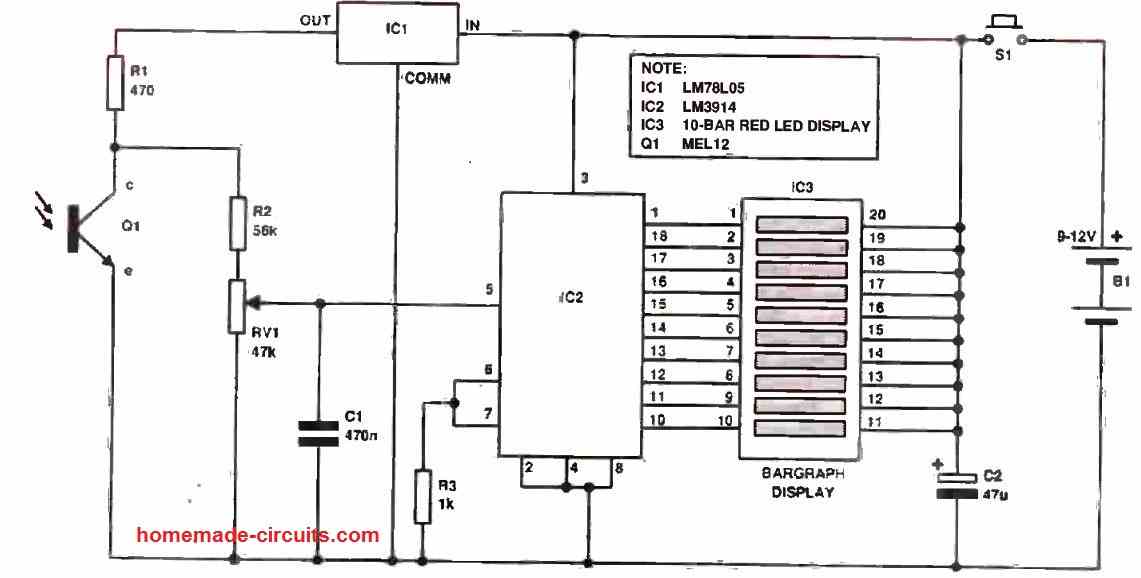
Circuit Description
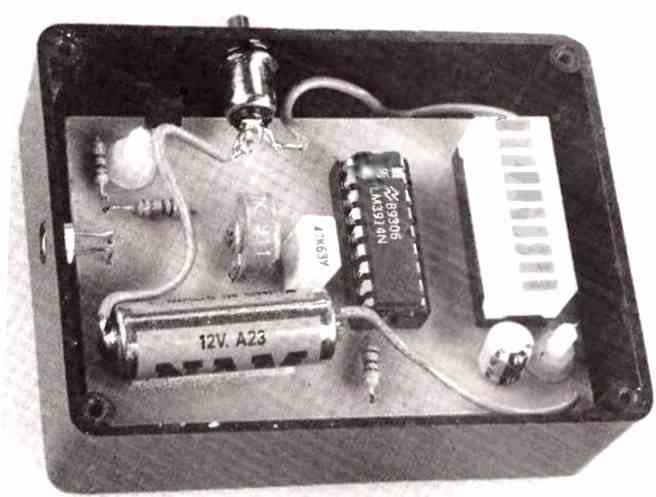
The Light Meter circuit comprises four primary components - the light sensor itself, bargraph driver, LED display, and a stabilized power supply for the light-sensing section.
The Figure above depicts the comprehensive circuit diagram.
The light sensor is a phototransistor labeled as Q1, featuring a window that permits light to enter and strike the base-collector junction.
This prompts an effect similar to that of a photodiode, resulting in a minute electric current, which is subsequently amplified through transistor action.
The intensity of this current increases proportionally with the brightness of the light, up to a certain threshold.
Consequently, escalating light intensity induces a corresponding rise in current flow through load resistor R1, thereby generating an augmented voltage across it.
This voltage drop manifests between the collector and emitter of Q1. The reduction in this voltage precipitates the activation of the remaining circuitry.
It is crucial to note that the specified phototransistor does not necessitate biasing, hence leaving the base unconnected.
The circuit operates on a 9V or 12V battery. Nevertheless, the phototransistor section draws power from a 5V supply obtained through voltage regulator IC1.
This is vital to counteract the diminishing voltage between the collector and emitter of Q1 as the battery voltage wanes over time.
Without regulation, this voltage decline would mistakenly indicate increased light brightness to the rest of the circuit, thereby disrupting the operating points of the bargraph.
Currently, the circuit functions correctly until the regulator fails to deliver a 5V output, which typically occurs when the battery voltage plummets below approximately 7V.
Subsequently, the regulator's output voltage dwindles proportionately. Consequently, periodic battery checks are imperative, and the procedure for conducting such checks is expounded upon towards the end.
When exposed to intense light, the phototransistor Q1 exhibits a voltage drop of roughly 0.7V between its collector and emitter terminals.
As the light level diminishes, this voltage gradually approaches the supply voltage of 5V. The voltage is attenuated through a potential divider consisting of fixed resistor R2 and adjustable potentiometer VR1.
The attenuated voltage is then applied to pin 5 of the bargraph driver IC2.
This integrated circuit adeptly handles smoothly varying voltages, and as the voltage ascends, sequential outputs (pins 1 to 10) successively decrease, serving as current sinks.
The first output triggers at 0.125V, while the tenth output triggers at 1.25V, necessitating the division of the voltage originating from Q1's collector by a factor of four.
This division is attained when the wiper of VR1 is positioned approximately midway. However, the voltage at the wiper can be adjusted within generous limits.
This adjustment enables precise calibration of the operational levels, which can be undertaken during the final stages of construction.
Stability is promoted by the presence of capacitor C1.
The bargraph display, IC3, comprises ten horizontal LED bars.
The positive terminals (anodes) of these LEDs (pins 11 to 20) are interconnected and connected to the positive supply rail.
The negative terminals (cathodes) of the LEDs (pins 1 to 10) are linked to the corresponding outputs of IC2. As each output diminishes, the corresponding LED bar illuminates.
Notably, conventional series resistors are rendered redundant since current limitation is managed within the integrated circuit itself, with resistor R3 determining the operating current for the LEDs, approximately 13mA in this instance.
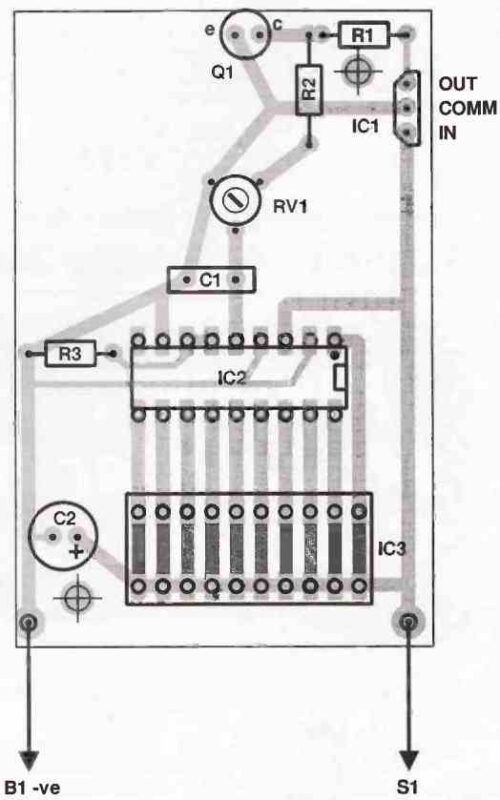
PCB Design
The PCB design for the above simple LM3914 bar graph light meter is shown below:

Questions & Answers
Hey there Swagatam, I’m also new to electrical engineering, could you please tell me why a cap before and after the op amp is necessary? Thanks!
Hi Nick, input capacitor is provided to filter out high frequency noises, while the output capacitor is for stabilizing the meter needle, otherwise the needle could vibrate, giving unreadable measurements.
Hi. I am not an electronics professional. I don’t know what are PR1 and PR2? Are there variable resistors? There are 3 connections through PRs.
Hi, yes those are variable resistors, also called presets or trimpots!
Hi, my friend!
Are you aware that materials are being stolen from you? View this: makingcircuits.com/blog/automotive-led-brake-light-circuit-making-use-of-1-watt-high-efficiency-leds/
Thanks friend, I appreciate your concern. yes I am aware, but I don’t care about it, it doesn’t make any difference to me.
in the sun the photo diode increases the voltage. the following inverting amplifier provides a decreasing voltage at the output are you sure ? is it ok ?
It is OK. The op amp works like a current to voltage converter
why do not explain it for the beginners ?
Thanks
The explanations may have many formulas and can be long, so it can be difficult to understand for the beginners. You can search “current to voltage converter” online, you will find the answer.