PWM stands for pulse width modulation which signifies the variable nature of the pulse widths that may be generated from a particular source such as a discrete IC, MCU, or a transistorized circuit.
What's PWM
In simple terms a PWM process is nothing but switching ON and OFF a supply voltage at a particular rate with different ON/OFF timing ratios, here the switch ON length of the voltage may be greater, smaller, or equal to the switch OFF length.
For example a PWM may consist a voltage fixed to switch ON and OFF at the rate of 2 second ON 1 second OFF, 1 second ON 2 second OFF or 1 second ON, 1 second OFF.
When this ON/OFF rate of a supply voltage are differently optimized we say that the voltage is a PWM or Pulse Width modulated.
You all must be already familiar regarding how a constant DC potential appears on a voltage v/s time graph as shown below:
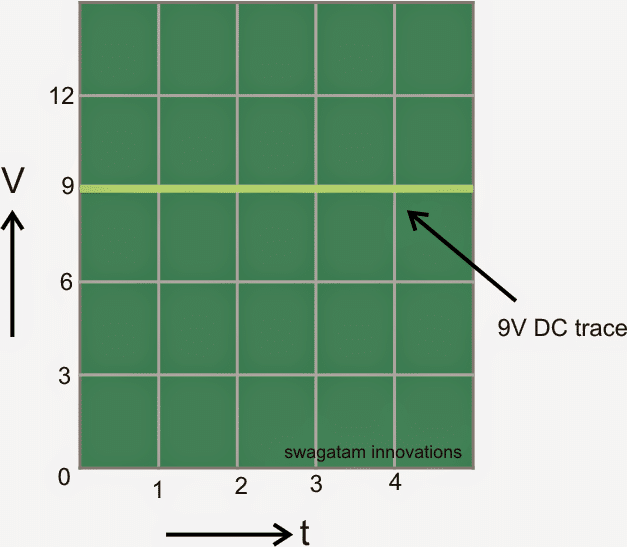
In the above image we can see a straight line at the 9V level, this is achieved because the 9V level in not changing with respect to time and therefore we are able to witness a straight line.
Now if this 9V is switched ON and OFF after every 1 second, then the above graph would look this this:
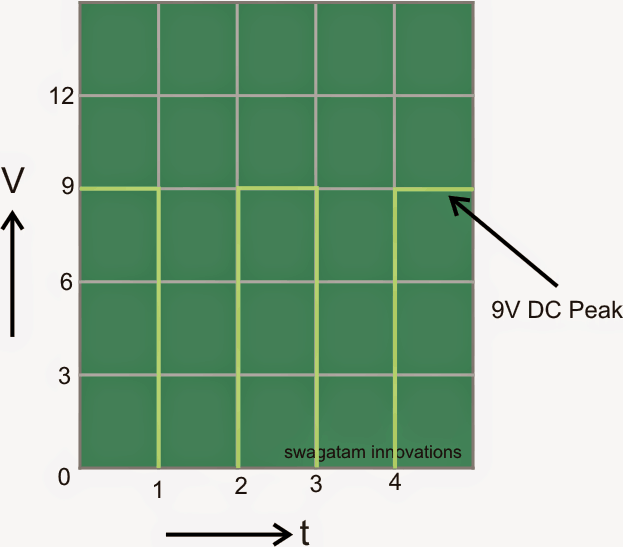
We can clearly see that now the 9V line is no longer a straight line rater in the form of blocks after every 1 second, since the 9V is switched ON and OFF after every second alternately.
The above traces look like rectangle blocks because when the 9V is switched ON and OFF the operations are instant which suddenly makes the 9V to go to zero level and then suddenly to the 9V level thereby forming the rectangular shapes on the graph.
The above condition gives rise to a pulsating voltage which has two parameters to be measured namely: the peak voltage and the average voltage or the RMS voltage.
Peak and Average Voltage
In the first image the peak voltage is obviously 9V, and the average voltage is also 9V simply because the voltage is constant without any breaks.
However in the second image, although the voltage is switched ON/OFF at 1 Hz rate (1 second ON, 1 second OFF) the peak will be still equal to 9V, because the peak is always reaching the 9V mark during the ON periods. But the average voltage here is not 9V rather 4.5V because the make and break of the voltage is done at a 50% rate.
In PWM discussions this ON/OFF rate is called duty cycle of the PWM, therefore in the above case it's a 50% duty cycle.
When you measure a PWM with a digital multimeter on a DC range you will always get the average value reading on the meter.
New hobbyists often get confused with this reading and take it as the peak value, which is entirely wrong.
As explained above the peak value of a PWM will be mostly equal to the supply voltage fed to the circuit, while the average volatge on the meter will be the average of the ON/OFF periods of the PWMs.
Switching Mosfet with PWM
So if you are switching a mosfet with a PWM and find the gate voltage to be, say for example 3V, don't panic since this could be just the average voltage indicated by the meter, the peak voltage could as high as your circuit's supply voltage.
Therefore the mosfet could be expected to be conducting fine and fully through these peak values and the average voltage would be only effecting its conduction period, not the switching spec of the device.
As I have explained in the previous sections, a PWM fundamentally involves the varying of the pulse widths, in other words the ON and the OFF periods of the DC.
Let's say for instance you want a PWM output with an ON time that's 50% less than that of the ON time.
Let's assume that thee selected ON time is 1/2 second then the OFF time would be equal to 1 second, that would give rise to a duty cycle of 1/2 second ON and 1 second OFF, as may be seen in the following diagram.
Analyzing the Duty Cycle of PWM
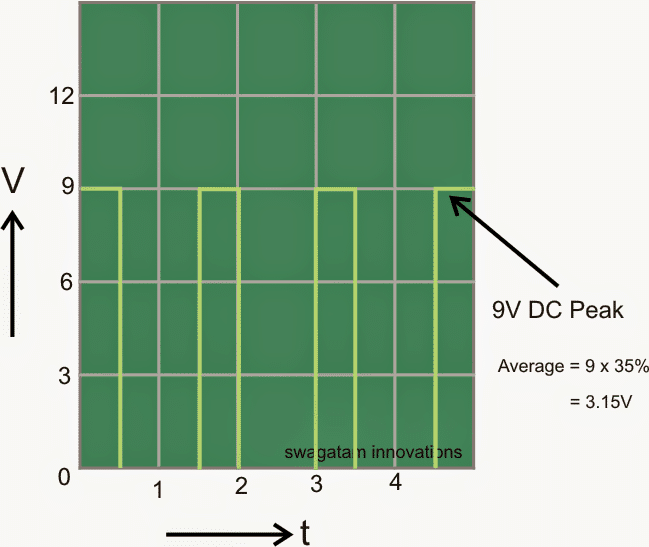
In this example the PWMs are optimized to produce a peak voltage of 9V but an average voltage of 3.15V since the ON time is just 35% of one full complete ON/OFF cycle.
One complete cycle refers to the time period which allows the given pulse to complete its one full ON time and one OFF time.
Similarly one may intend to optimize the pulse width of a frequency with the following data:
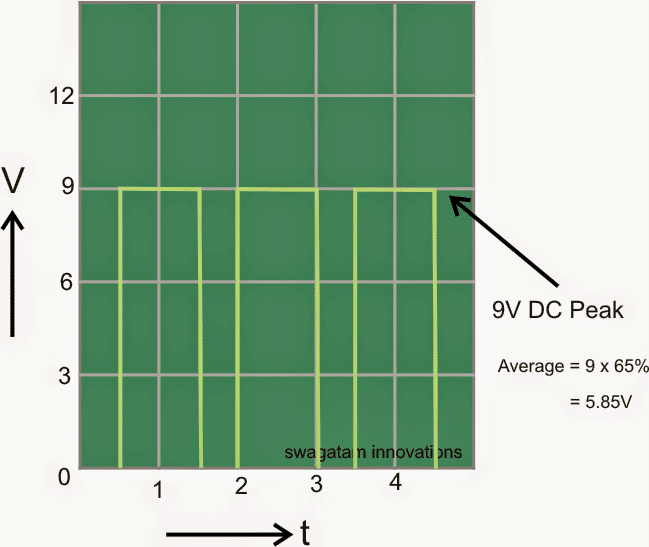
Here the ON time can be seen increased than the OFF time by 65% across one full cycle, therefore here the average value of the voltage becomes 5.85V.
The above discussed average voltage is also called the RMS or the root mean square value of the voltage.
Since these are all rectangular or square pulses, the RMS can be calculated simply by multiplying the duty cycle percentage with the peak voltage.
Optimizing PWM to Simulate Sinewave
However in cases where the PWM is optimized to simulate an AC pulse, the calculation for the RMS becomes a little complex.
Let's take the example of the following PWM which is optimized to vary its width corresponding to the varying amplitude or the level of a Sinusoidal AC signal.
You can learn more about this through one of my previous articles where I have explained how the IC 555 can be used for generating sine wave equivalent PWM output.
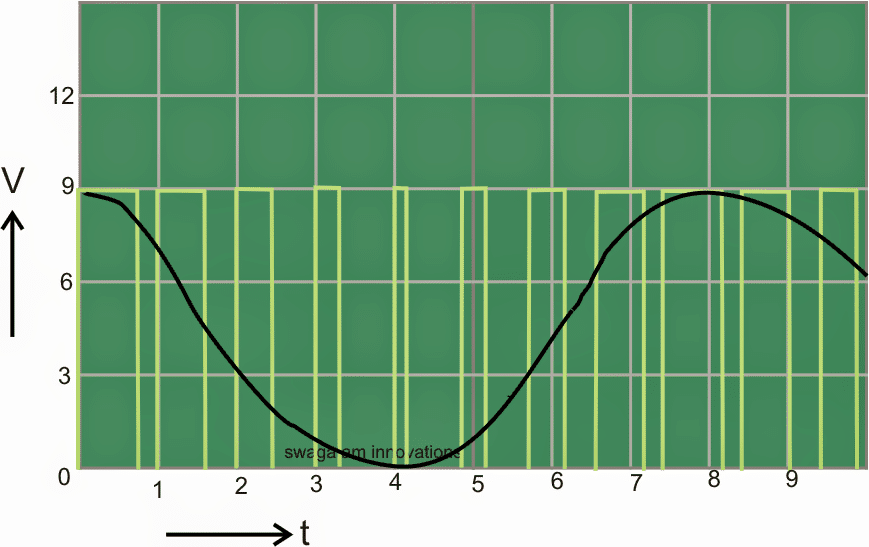
As we can see in the above image the width of the pulses are changing with regard to the instantaneous level of the sine wave. As the sine wave tends to reach the peak, the corresponding width of the pulse becomes wider and vice versa.
Using SPWM
This indicates that because the sine wave voltage level is constantly changing with time the PWMs are also changing with time by constantly varying its widths. Such PWM is also referred to as SPWM or Sinewave Pulse Width Modulation.
Thus in the above case the pulses are never constant rather are changing their widths differently with time.
This makes its RMS or the average value calculation a little complex and we cannot simply multiply the duty cycle with the peak voltage here for achieving the RMS.
Although the actual formula for deriving the RMS expression is quite complex, after appropriate derivations the final implementation actually gets quite easy.
Calculating RMS voltage of a PWM
Thus for calculating RMS of a varying PWM voltage in response to a sine wave may be acquired by multiplying 0.7 (constant) with the peak voltage.
So for a 9V peak we get 9 x 0.7 = 6.3V, that's the RMS voltage or the average value of a 9V peak to peak PWM simulating a sine wave.
Role of PWM in Electronic Circuits?
You will find that the PWM concept is essentially associated with
circuit designs which have inductors involved especially the buck boost topologies such as inverters, SMPS, MPPT, LED driver circuits etc.
Without an inductor a PWM feature might have no real value or role in a given circuit, this is because only an inductor has the inherent feature of transforming a varying pulse width into an equivalent amount of stepped up (boosted) or stepped down (bucked) voltage or current, which becomes the whole and sole idea of a PWM technology.
Using PWM with Inductors
To understand how PWM effects an inductor output in terms of voltage and current, it would be first important to learn how an inductor behaves in the influence of a pulsating voltage.
In one of my previous posts I explained regarding how a buck boost circuit works, this is a classic example to demonstrate how PWMs or a varying pulse width can be used to dimension an inductor output.
It is well known that by "nature" an inductor always opposes a sudden application of voltage across it and allows it to pass only after a certain amount of time depending upon its winding specs, and during this process it stores an equivalent amount of energy in it.
Now if in the course of the above process the voltage is suddenly turned OFF, the inductor again is unable to cope up with this sudden disappearance of the applied voltage and tries to balance it out by releasing the stored current in it.
Reaction of Inductor to PWM
Thus an inductor will try to oppose a switching ON of voltage by storing current and try to equalize in response to a sudden switch OFF of voltage by "kicking" the stored energy back into the system.
This kick back is called the back EMF of an inductor and the content of this energy (voltage, current) will depend on the inductor winding specs.
Basically the number of turns decides whether the EMF should be higher in voltage than the supply voltage or lower than the supply voltage, and the thickness of the wire decides the amount current the inductor may be able to render.
There's another aspect t the above inductor, which is the timing of the voltage ON/OFF periods.
That's where the use of a PWM becomes crucial.
Although the number of turns fundamentally determine the output values for a particular, these can also varied as desired by feeding an optimized PWM intro an inductor.
Through a variable PWM we can force an inductor to generate/convert voltages and currents at any desired rate, either as a stepped up voltage (reduced current), or stepped up current (reduced voltage) or vice versa.
In some applications a PWM may be used even without an inductor, such as for dimming an LED light, or in MCU timer circuits, where the output may be optimized to generate voltages at different switch ON, switch OFF periods for controlling a load as per its intended working specifications.

Questions & Answers
unfortunately i have no oscilloscope. the carrier frequency is changing duty cycle according to the table of sine with 32 values that is
const unsigned char sine_table [34] = { 0, 15, 30, 45, 60, 75, 90, 105, 120, 135, 150, 165, 180, 195, 210, 225, 239, 239, 225, 210, 195, 180, 165, 150,
135, 120, 105, 90, 75, 60, 45, 30, 15, 0};
duty cycle is changing according to these values
Are you feeding the carrier wave and the 50 Hz reference waves into a comparator for generating the SPWM? In that case the carrier frequency needs to have a fixed duty cycle, and it should be preferably in the form of triangle waves.
If you are getting the PWMs with varying duty cycle from the Arduino, that could be by itself an SPWM. You can verify it only with an oscilloscope. So may be you are getting an SPWM directly from the Arduino which means you don’t need the comparator stage.
From the image I cannot make out if it is a proper SPWM or not.
yes this is the carrier wave form directly from pic micro controller. based on above sine table. that is carrier wave show varying dc voltage.
Are you feeding it to a comparator, along with the 50Hz reference?
no, i am feeding it to H-bridge using TLP250 to get AC voltage with sine wave form from micro controller as shown in picture.
OK, that means you are generating the SPWM from the Arduino and feeding it to the H-bridge configuration.
In SPWM the duty-cycle varies continuously and that is why you are seeing varying DC values on your DMM.
off course i generating it through Arduino and it is giving varying dc voltage. if for checking purpose both 50Hz reference & SPWM after rectification give same voltage about 4.9vdc on DMM. without rectification on oscilloscope both 50Hz & SPWM give peak value of 4.9vdc .
but a person with some experience in electronics tell me that both SPWM and 50Hz reference wave will show same voltage on DMM .
i also think that SPWM is varying duty cycle continuously based on
sine table above then how it is possible that they will show same reading.
If you are using a filter capacitor after rectification and if both the voltages are identical, that indicates that the peak levels of both the voltage are equal, so now the duty cycle factor will have no effect.
If it is showing identical voltage without a filter capacitor that means the average duty cycle of the both the voltages are equal.
But anyway the average voltage will always depend on the duty cycle of any waveform.
yes, i used filter capacitor after rectification showing identical voltage. it mean this variation is not a problem but is due to varying SPWM duty cycle.
thanks a lot sir this discussion has clear my problem.
now i’m going to make a simple transformer less inverter at low DC bus voltage of 60vdc – 80vdc.
You are most welcome Sheraz,
Yes, the filter capacitor will store the peak level and will always provide the peak level to the DMM showing a constant identical voltage for both the PWMs.
All the best to you!
sir i want to make dc to ac transformer less inverter. only testing SPWM driver module having 2 Signal having carrier frequency on CCP1 about 7.8 KHz & 2 have 50Hz. in above post i wrote it mistakenly 7.8Hz . testing with DMM dc voltage range. voltage at carrier frequency pin CCP1 not constant but fluctuate b/w 1.6 to 3.5vdc. while 50Hz pin show constant voltage of 2.5vdc. i didn’t have idea whether this 1.6 to 3.5vdc variation is of due to 7.8KHz or due to some programming mistake. i want to clarify why 1.6 to 3.5vdc variation occur?
A person tells me that by checking using DMM dc voltage range
all PWM pulses will show same voltage in SPWM module. but with me 50Hz is show 2.5vdc and 7.8KHz is varying b/w 1.6 to 3.5vdc
Sheraz,
The fluctuations could be due to the high frequency RF disturbance, if we assume the frequency to have a constant waveform.
No, all PWMs will show different average DC voltages on DMMs depending opon the duty cycle of the PWM. For example if the duty cycle is 50% then the average DC will equal to 50% of the peak voltage of the PWM.
Do you have an oscilloscope? You can test the 7.8kHz frequency with an oscilloscope to verify if the duty cycle of the frequency is constant or not.
Dear sir! i have simulated and now only testing micro controller driver SPWM with pic16f72 for dc to ac inverter but stuck in a problem with lot of confusion. setting desired frequency at 50Hz and carrier frequency about 7.8 Hz. while measuring output voltage of carrier frequency pin using dc voltage setting in multi meter the voltage fluctuate b/w 1.6v to 3.6v while at 50Hz pin it remain constant at 2.45v. here i confused, for IGBT this fluctuation is fatal or not
Hello Sheraz,
The carrier frequency must be a lot higher than the reference frequency of 50 Hz.
So please use at least 300 Hz for the carrier frequency if the transformer is iron core, or make it 10kHz if the transformer is a ferrite core.
Let me know how it goes…